
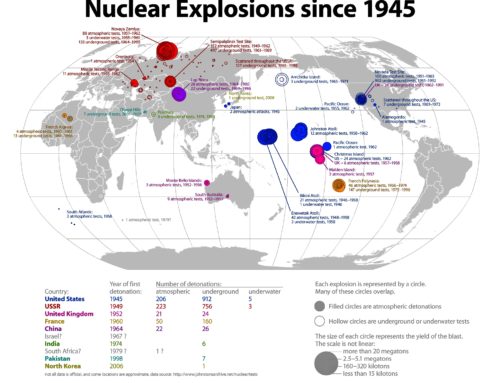
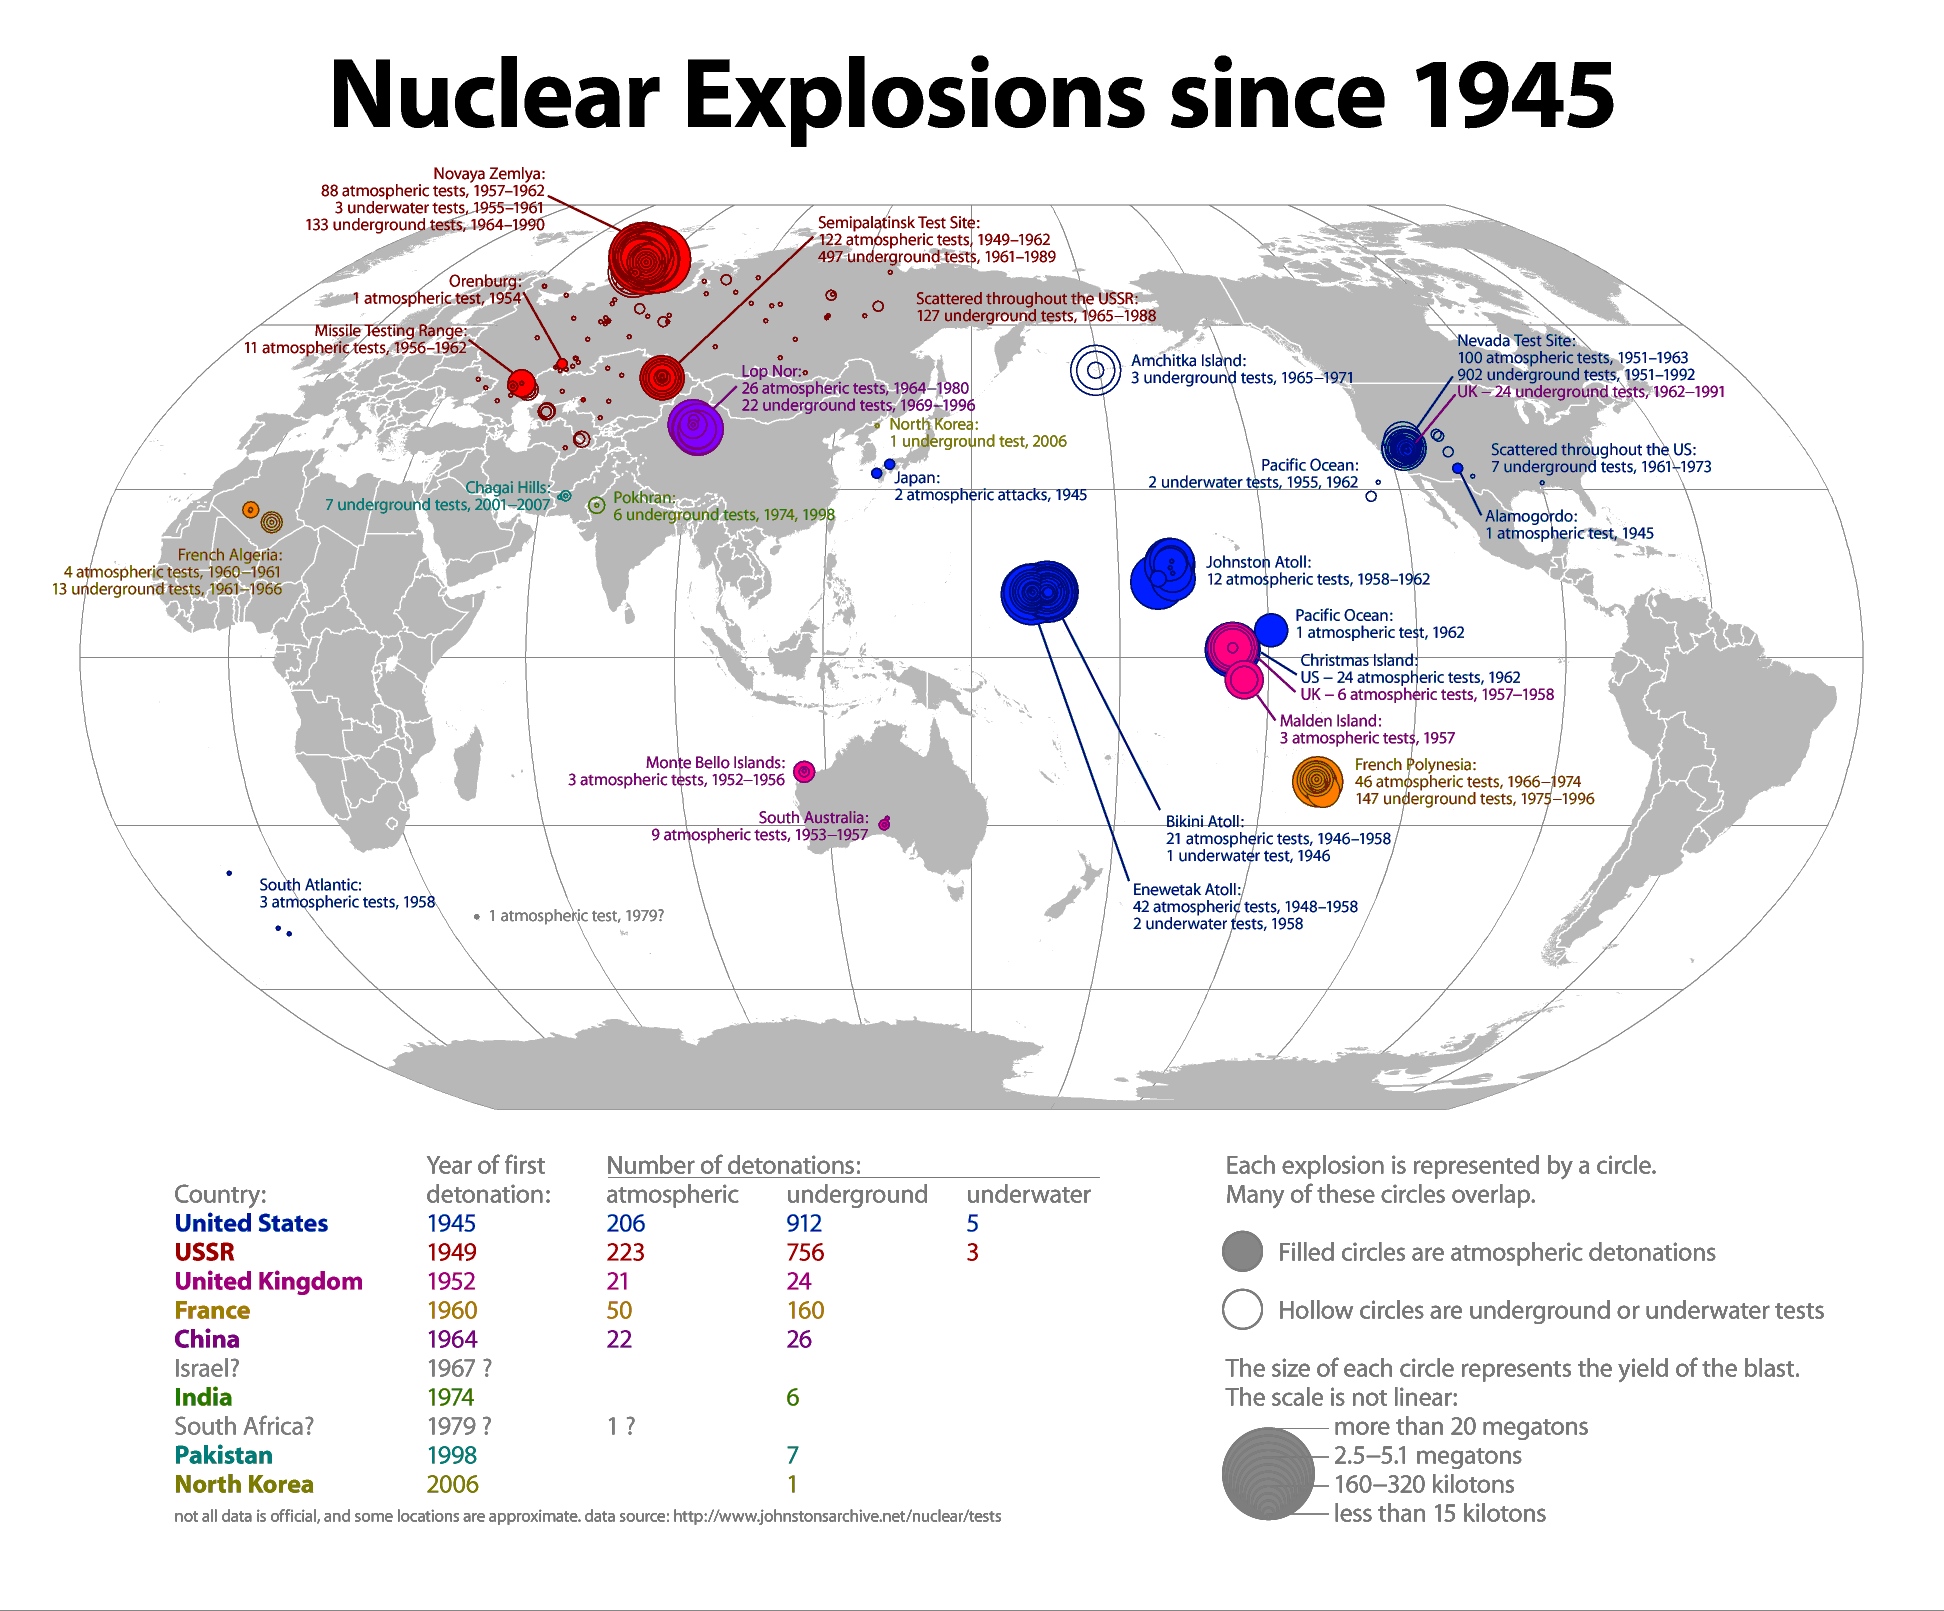
Designing for big data is a cool speech about data visualization that meets storytelling by Jeff Veen (via Tom’s feed).
just one note: at 11:50 Jeff says that’s important to remove “useless infos” and cites the London subway example. That chart is not “geographically precise” it means that sometimes people can lose time in the underground while they could just walk outside to get to their destination (here the london subway map comparison ). Just like in story telling… in our jobs remembering the details makes the difference.
In my SEO job I noticed that similar lack of details when I browse Google Analytics data to find new long tail search engine keywords for my customers (I had to switch website statistics system because of that).
Anyway Jeff’s speech features a cool barnum effect with interesting subjects and it’s worth watching.
